The moar profile viewer, available at https://moar-things.github.io/moar-profile-viewer , can be used to view v8 CPU profiles generated for Node.js applications.
For more information and background on v8 CPU profiles, see the article Speed Up JavaScript Execution .
The following tools can be used to generate a v8 CPU profile for Node.js:
Most tools generate CPU profile files with a file extension of .cpuprofile . Once you have a CPU profile file, you can view it by visiting https://moar-things.github.io/moar-profile-viewer . You can either drag the file onto the web page, or load it from an input button on the page.
There are a few .cpuprofile files available in the moar-profile-viewer repository in the test/fixtures directory . You probably want to try the "real life" on of a run of npm update, which you can download via this link: npm-update.moar.cpuprofile .
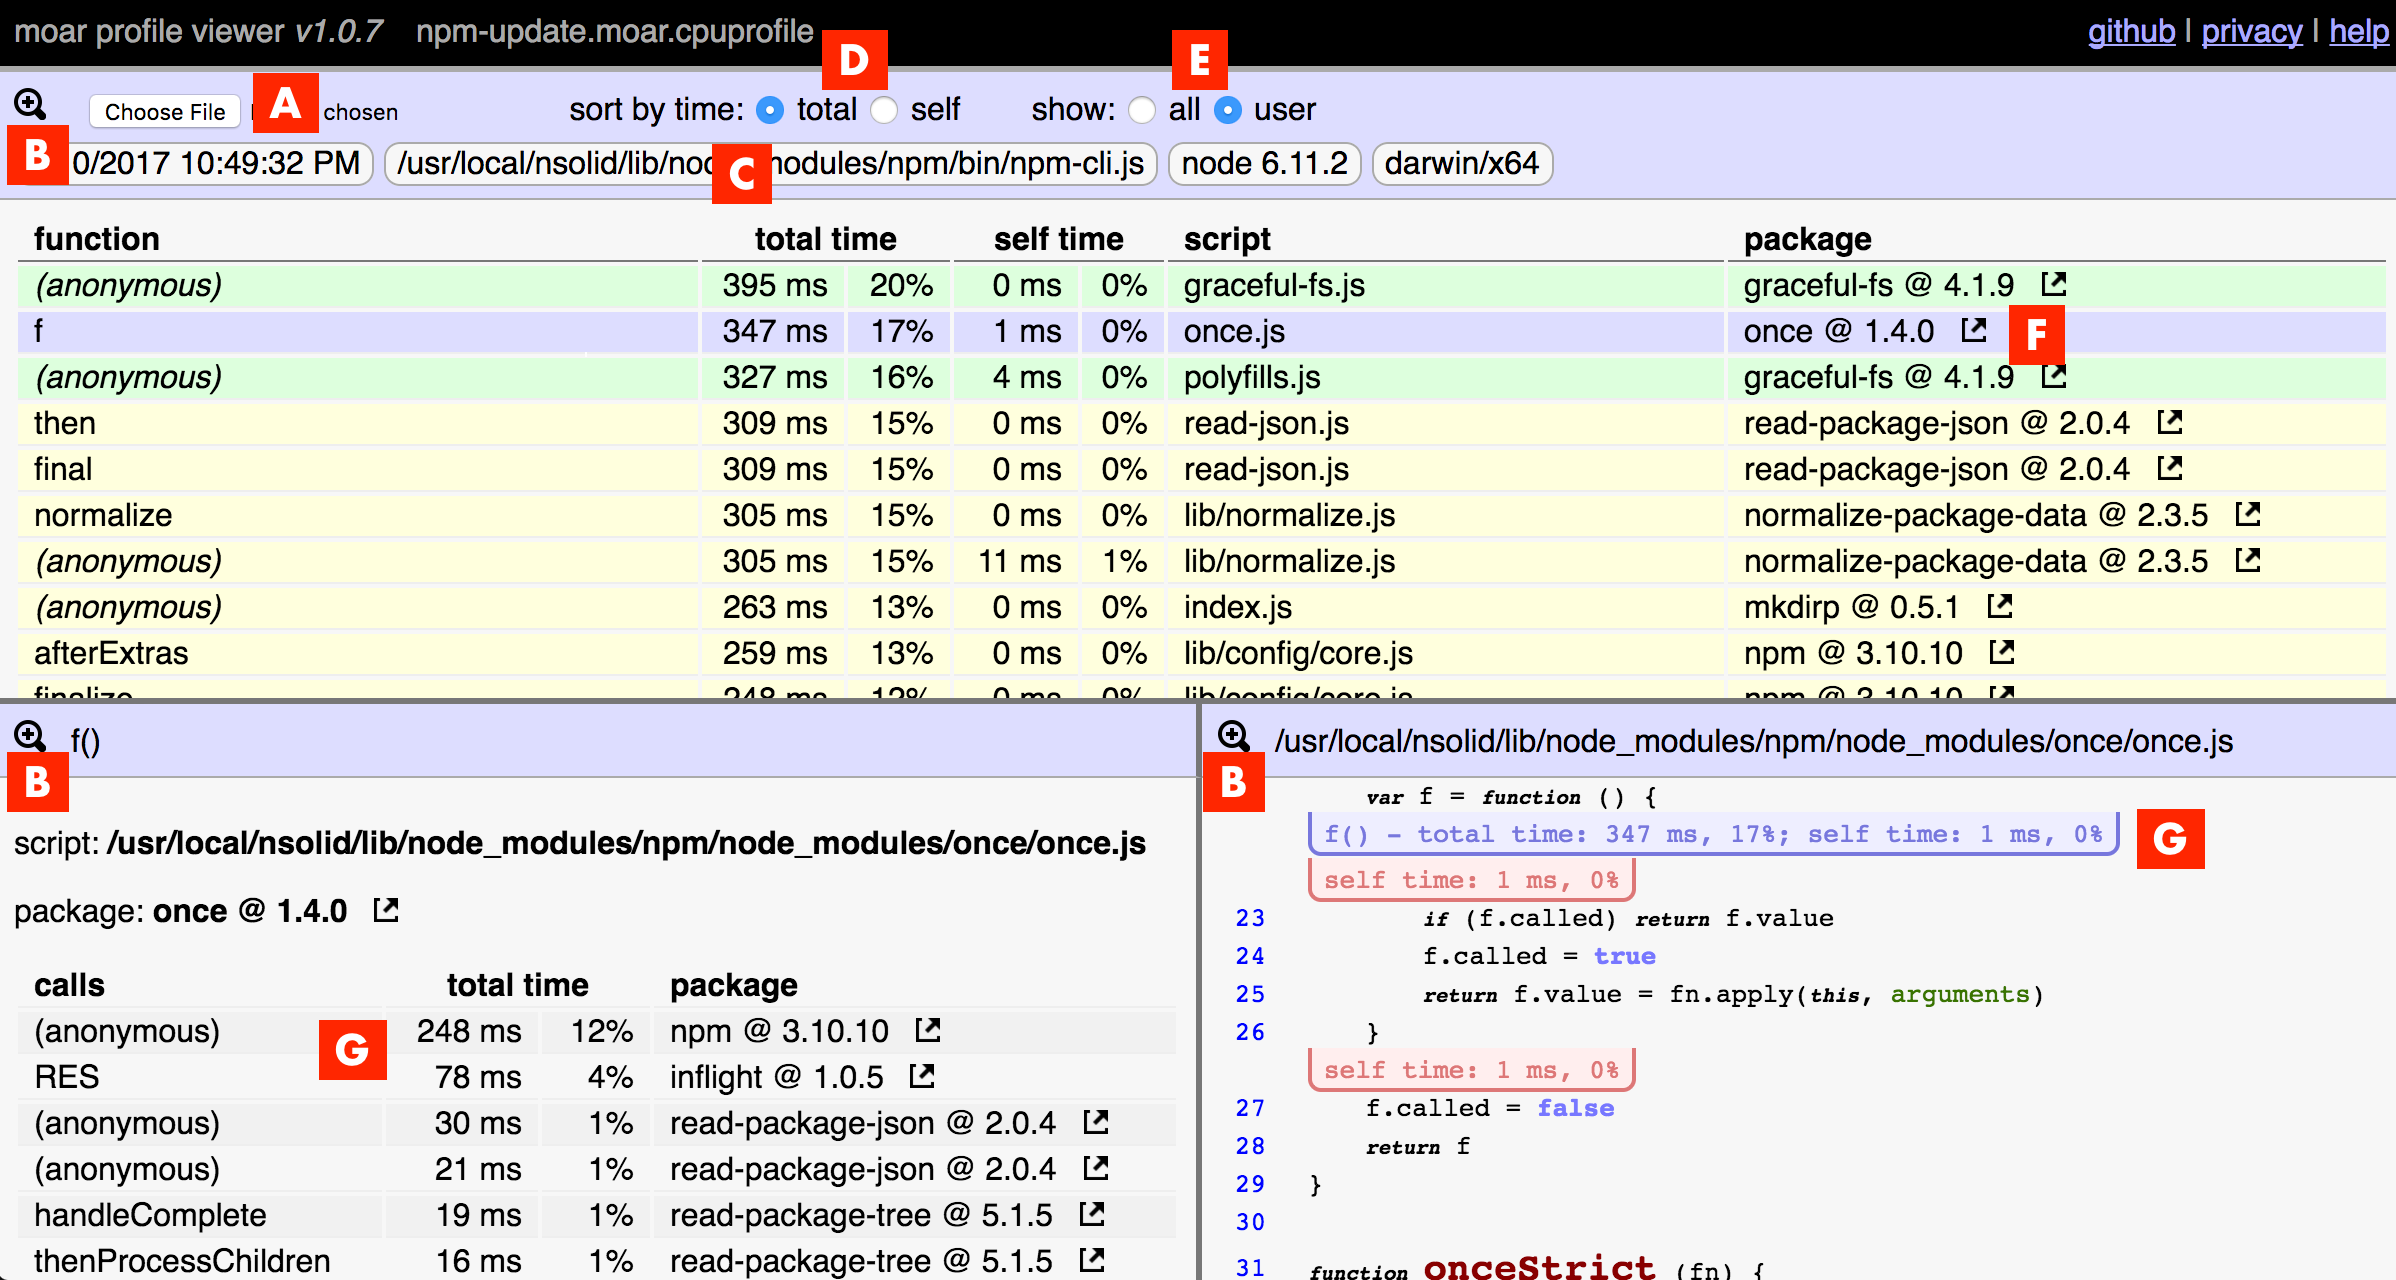
Below is the web page with a profile loaded.
The page is split into three panes:
When you click on a function in any of the three panes, the top pane will scroll to that function, and highlight it in purple to indicate that it's the currently selected function. Other functions in the top pane will be colored green or yellow if the selected function is called by the function (green) or calls the function (yellow).
The bottom panes will be updated to show relevant information for the selected function. Functions which are called by, or that call the selected function, will be shown in the top pane with a yellow highlight.
The source code in the bottom right pane is annotated with blue and red lines and bubbles. The blue lines and bubbles indicate functions which are listed in the top pane. The red lines and bubbles are lines within a function which the profile recorded statistics for.
To load a CPU profile from within this page, click the file upload button shown at A, which will prompt you for a file to load. Or you can drag and drop a file onto the web page.
You can "zoom" into a pane (hiding the other panes) by clicking the "zoom buttons" shown at B.
Information about your Node.js process is shown on the line at C. This information is only available with profiles generated with moar-profiler.
Functions in the top pane can be sorted by total time or self time, by clicking the respective buttons at D.
By default, only functions shown in "user" code is displayed. "User" code is code not shipped with the Node.js runtime; eg, the built-in modules fs, path, etc, are not "user" code. You can change to show all code, or back to just "user" code, by clicking the respective buttons at E.
The "link" image beside package names, shown at F, will open that package's page at npmjs.org, when clicked.
Where functions are shown in the bottom panes, they can be clicked to change the page to show information about that function. Examples are shown at G.
The V8 CPU Profiler occaisonally provides information about particular lines within a function; those lines are annotated with a red bubble. Note that the V8 CPU Profiler typically doesn't provide many of these.
Keep in mind that a function can both call a function and be called by the same function. Those functions are marked green (calls selected function).
V8 does a great job inlining functions, as an optimization. That is, it moves the body of a function into the caller of the function. When this happens, the function that gets reported will be the caller, not the actual function. Consider using the option --no-use_inlining when running your node application to turn off inlining, to get the correct accounting.
You may have found a bug! Feel free to open an issue . Expect that you may need to provide your `.cpuprofile` file, to reproduce the issue.
If you are having problems using the moar-profiler tool or the moar profile viewer web page, consider opening an issue at GitHub on the respective repository: